Approach
Trase maps international trade in agricultural commodities, revealing how trading companies and consuming markets are connected to deforestation and other environmental impacts in producing countries. We provide global and subnational commodity supply chain datasets, environmental impact metrics including deforestation and greenhouse gas emissions, as well as information about commodity storage and processing facilities. Our global data provides an overview of the sustainability of international commodity trade connecting countries of production with consuming countries for more than 160 agricultural commodities. Our subnational data enables subnational and company specific supply chain analysis for key forest risk commodities such as Brazilian beef and Indonesian palm oil.
A step-by-step journey
How do we map commodity supply chains?
1 • Collect trade data
Supply chain mapping begins with gathering trade data for our global and subnational analysis. Our global assessments use country-to-country aggregated trade records, re-export information and financial flows. Our subnational assessment starts with ‘per shipment’ trade records detailing individual export shipments. Both approaches use standardised product classifications known as Harmonised System (HS) codes. Per-shipment trade records are different from aggregated country-to-country trade data because they provide the names of importing and exporting companies. This allows us to identify companies in the supply chain and is a key piece of information needed to connect shipments to areas where commodities are produced.
2 • Identify facilities and sourcing areas in producing countries
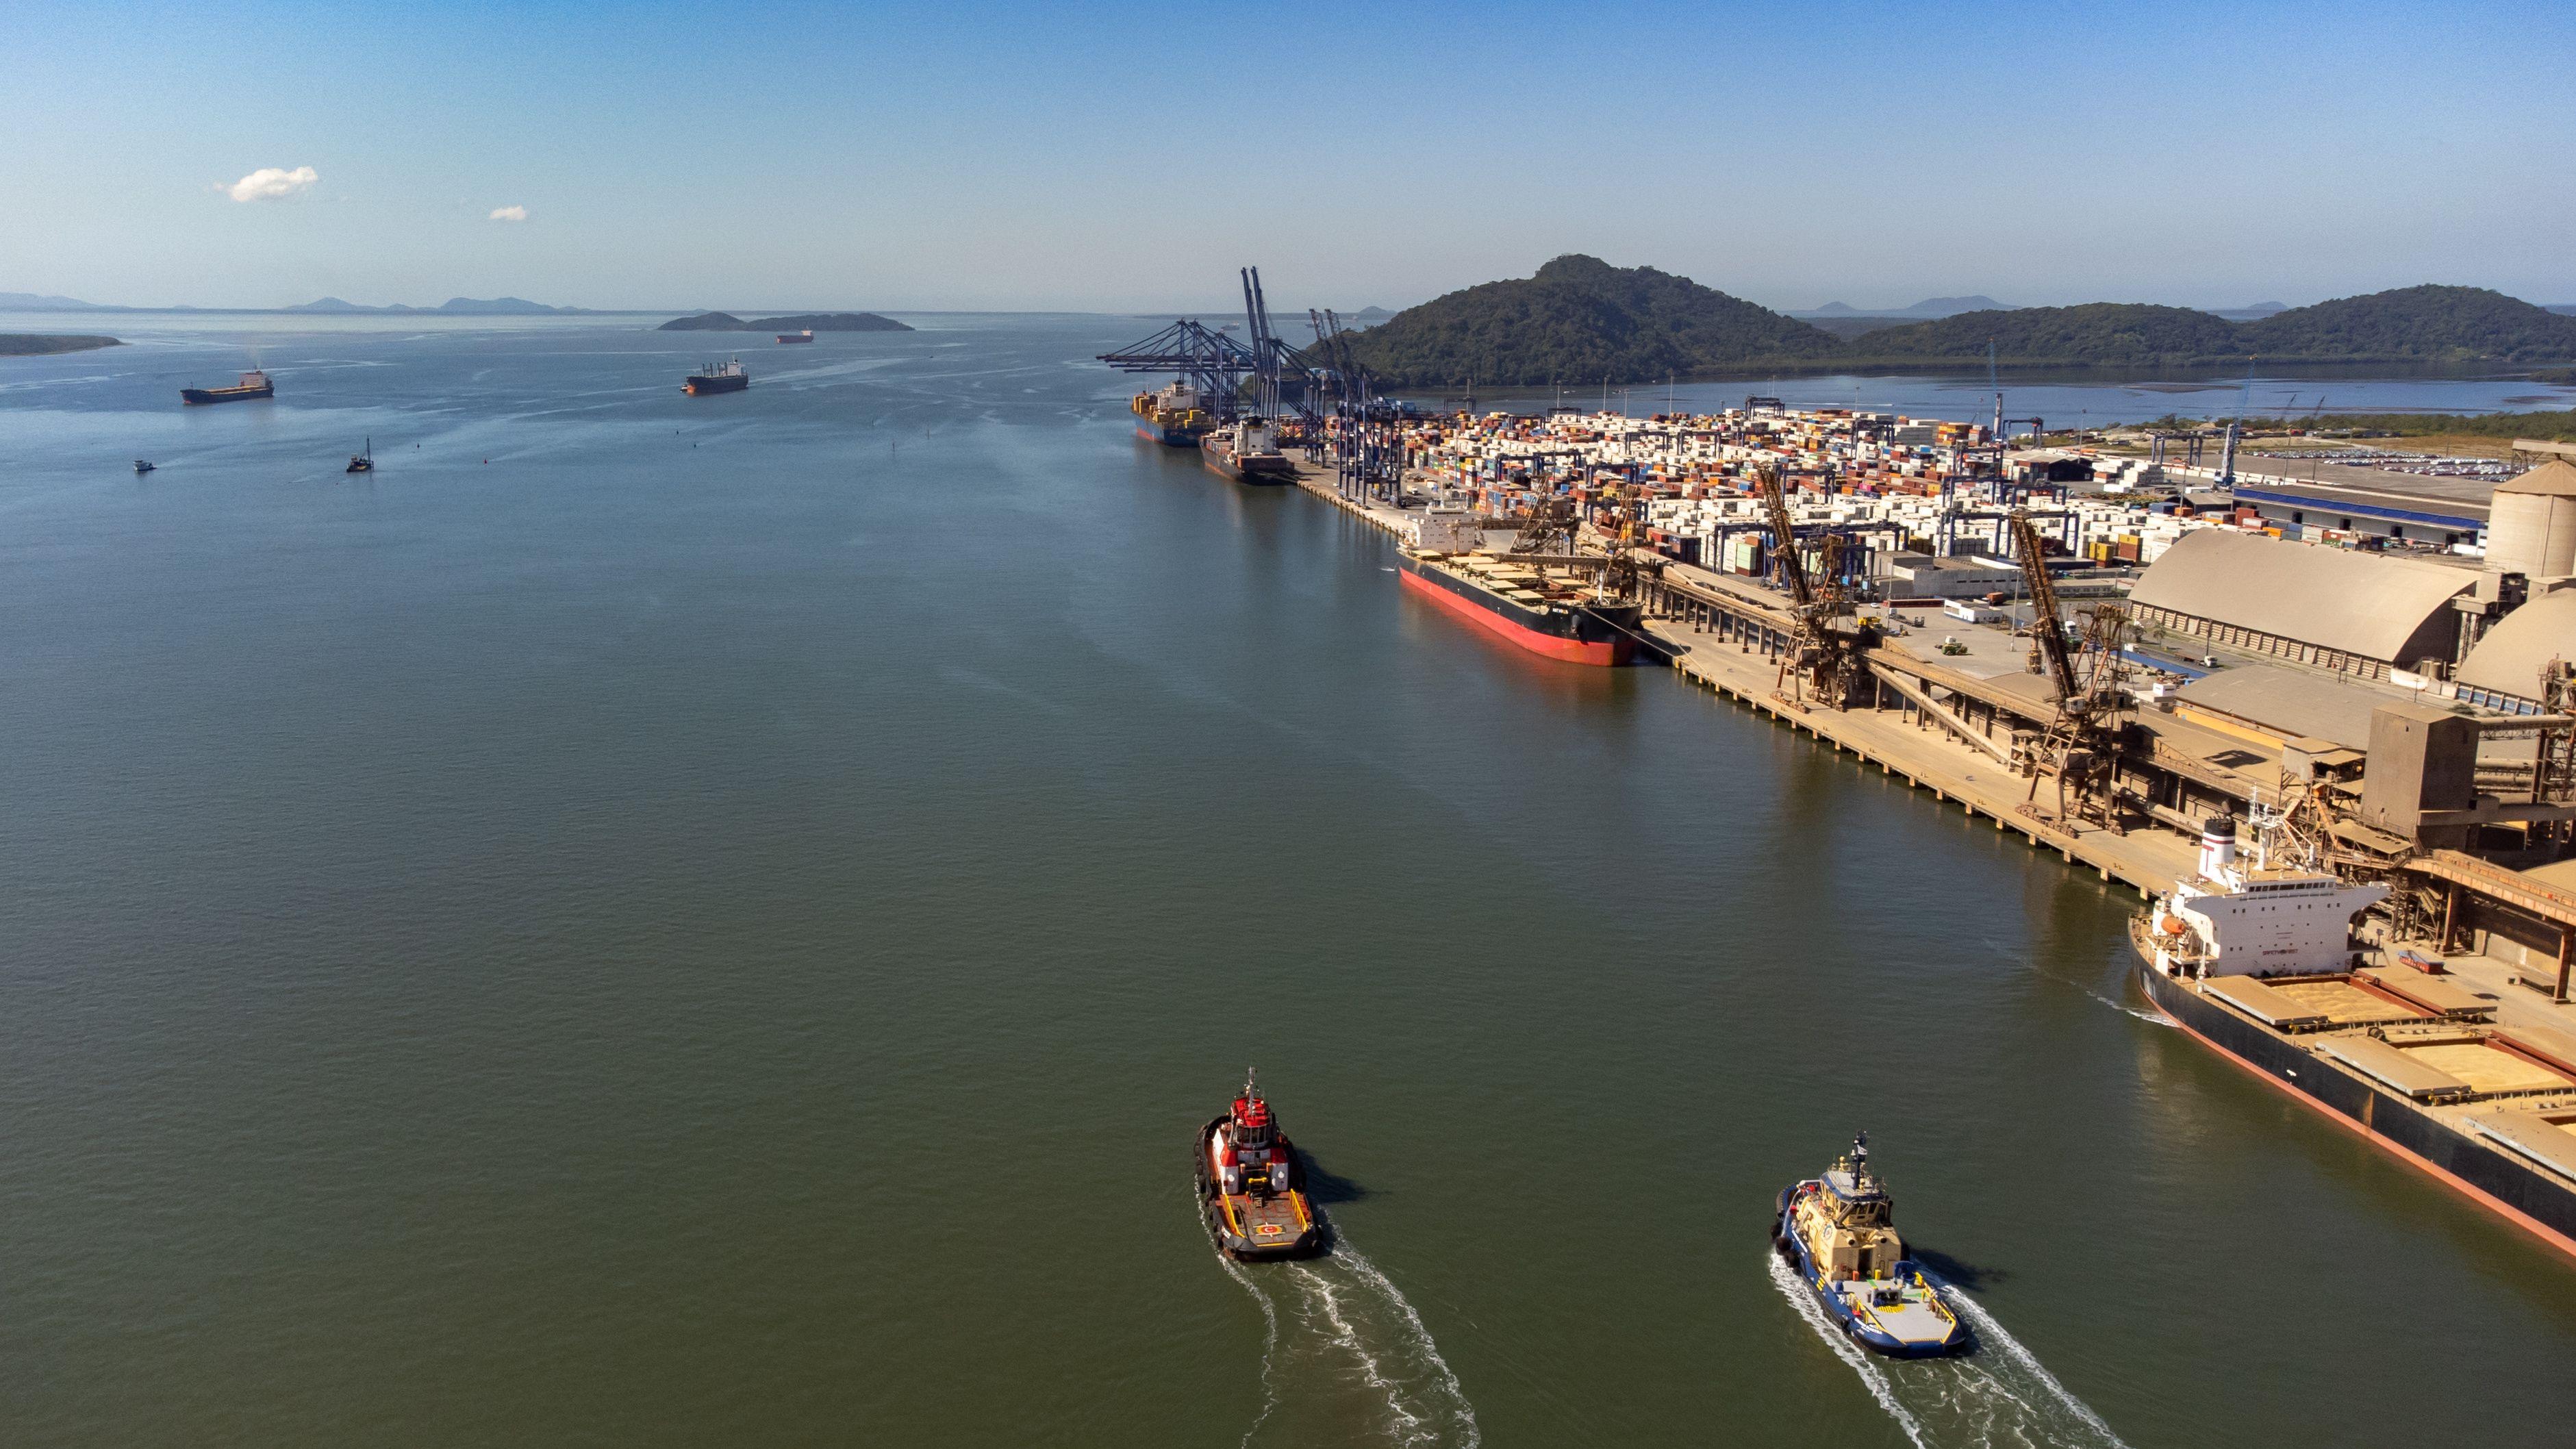
Our subnational assessments trace commodity supply chains from individual shipment records back to the areas where commodities are produced. We follow supply chains upstream from export vessels through key logistical hubs and processing facilities, such as silos, warehouses, slaughterhouses and processing plants, to the areas where production takes place.
To achieve this, we compile information on the location, ownership and capacity of these facilities from publicly available datasets, satellite imagery and artificial intelligence. We then link per-shipment trade records to facilities using information on corporate ownership and public disclosures, traceability reports and government registries. In cases where a direct link cannot be established, we estimate likely sourcing pathways using optimisation models, facility-capacity allocations and other empirically informed methods. This step does not apply to our global assessments (see below).
3 • Link commodity exports to consuming countries and sectors
Our subnational analysis uses per-shipment trade data to track exported commodities to the first port of entry into the consuming markets; for example, Rotterdam in the Netherlands for EU imports.
Our global analysis traces commodities further downstream. We use three progressive levels of accounting: direct trade, re-export adjusted trade, and consumption-based accounting. Direct trade tracks point-to-point international trade using UN records. Re-export adjusted trade accounts for intermediate countries and processing steps that a product passes through before reaching its final destination, also using UN records. Consumption-based accounting traces the product all the way to the final consumer using the Input-Output Trade Analysis (IOTA) model, which maps financial flows between economic sectors to connect the origin point to the final consumed product.

4 • Attribute environmental impacts of commodity production and consumption
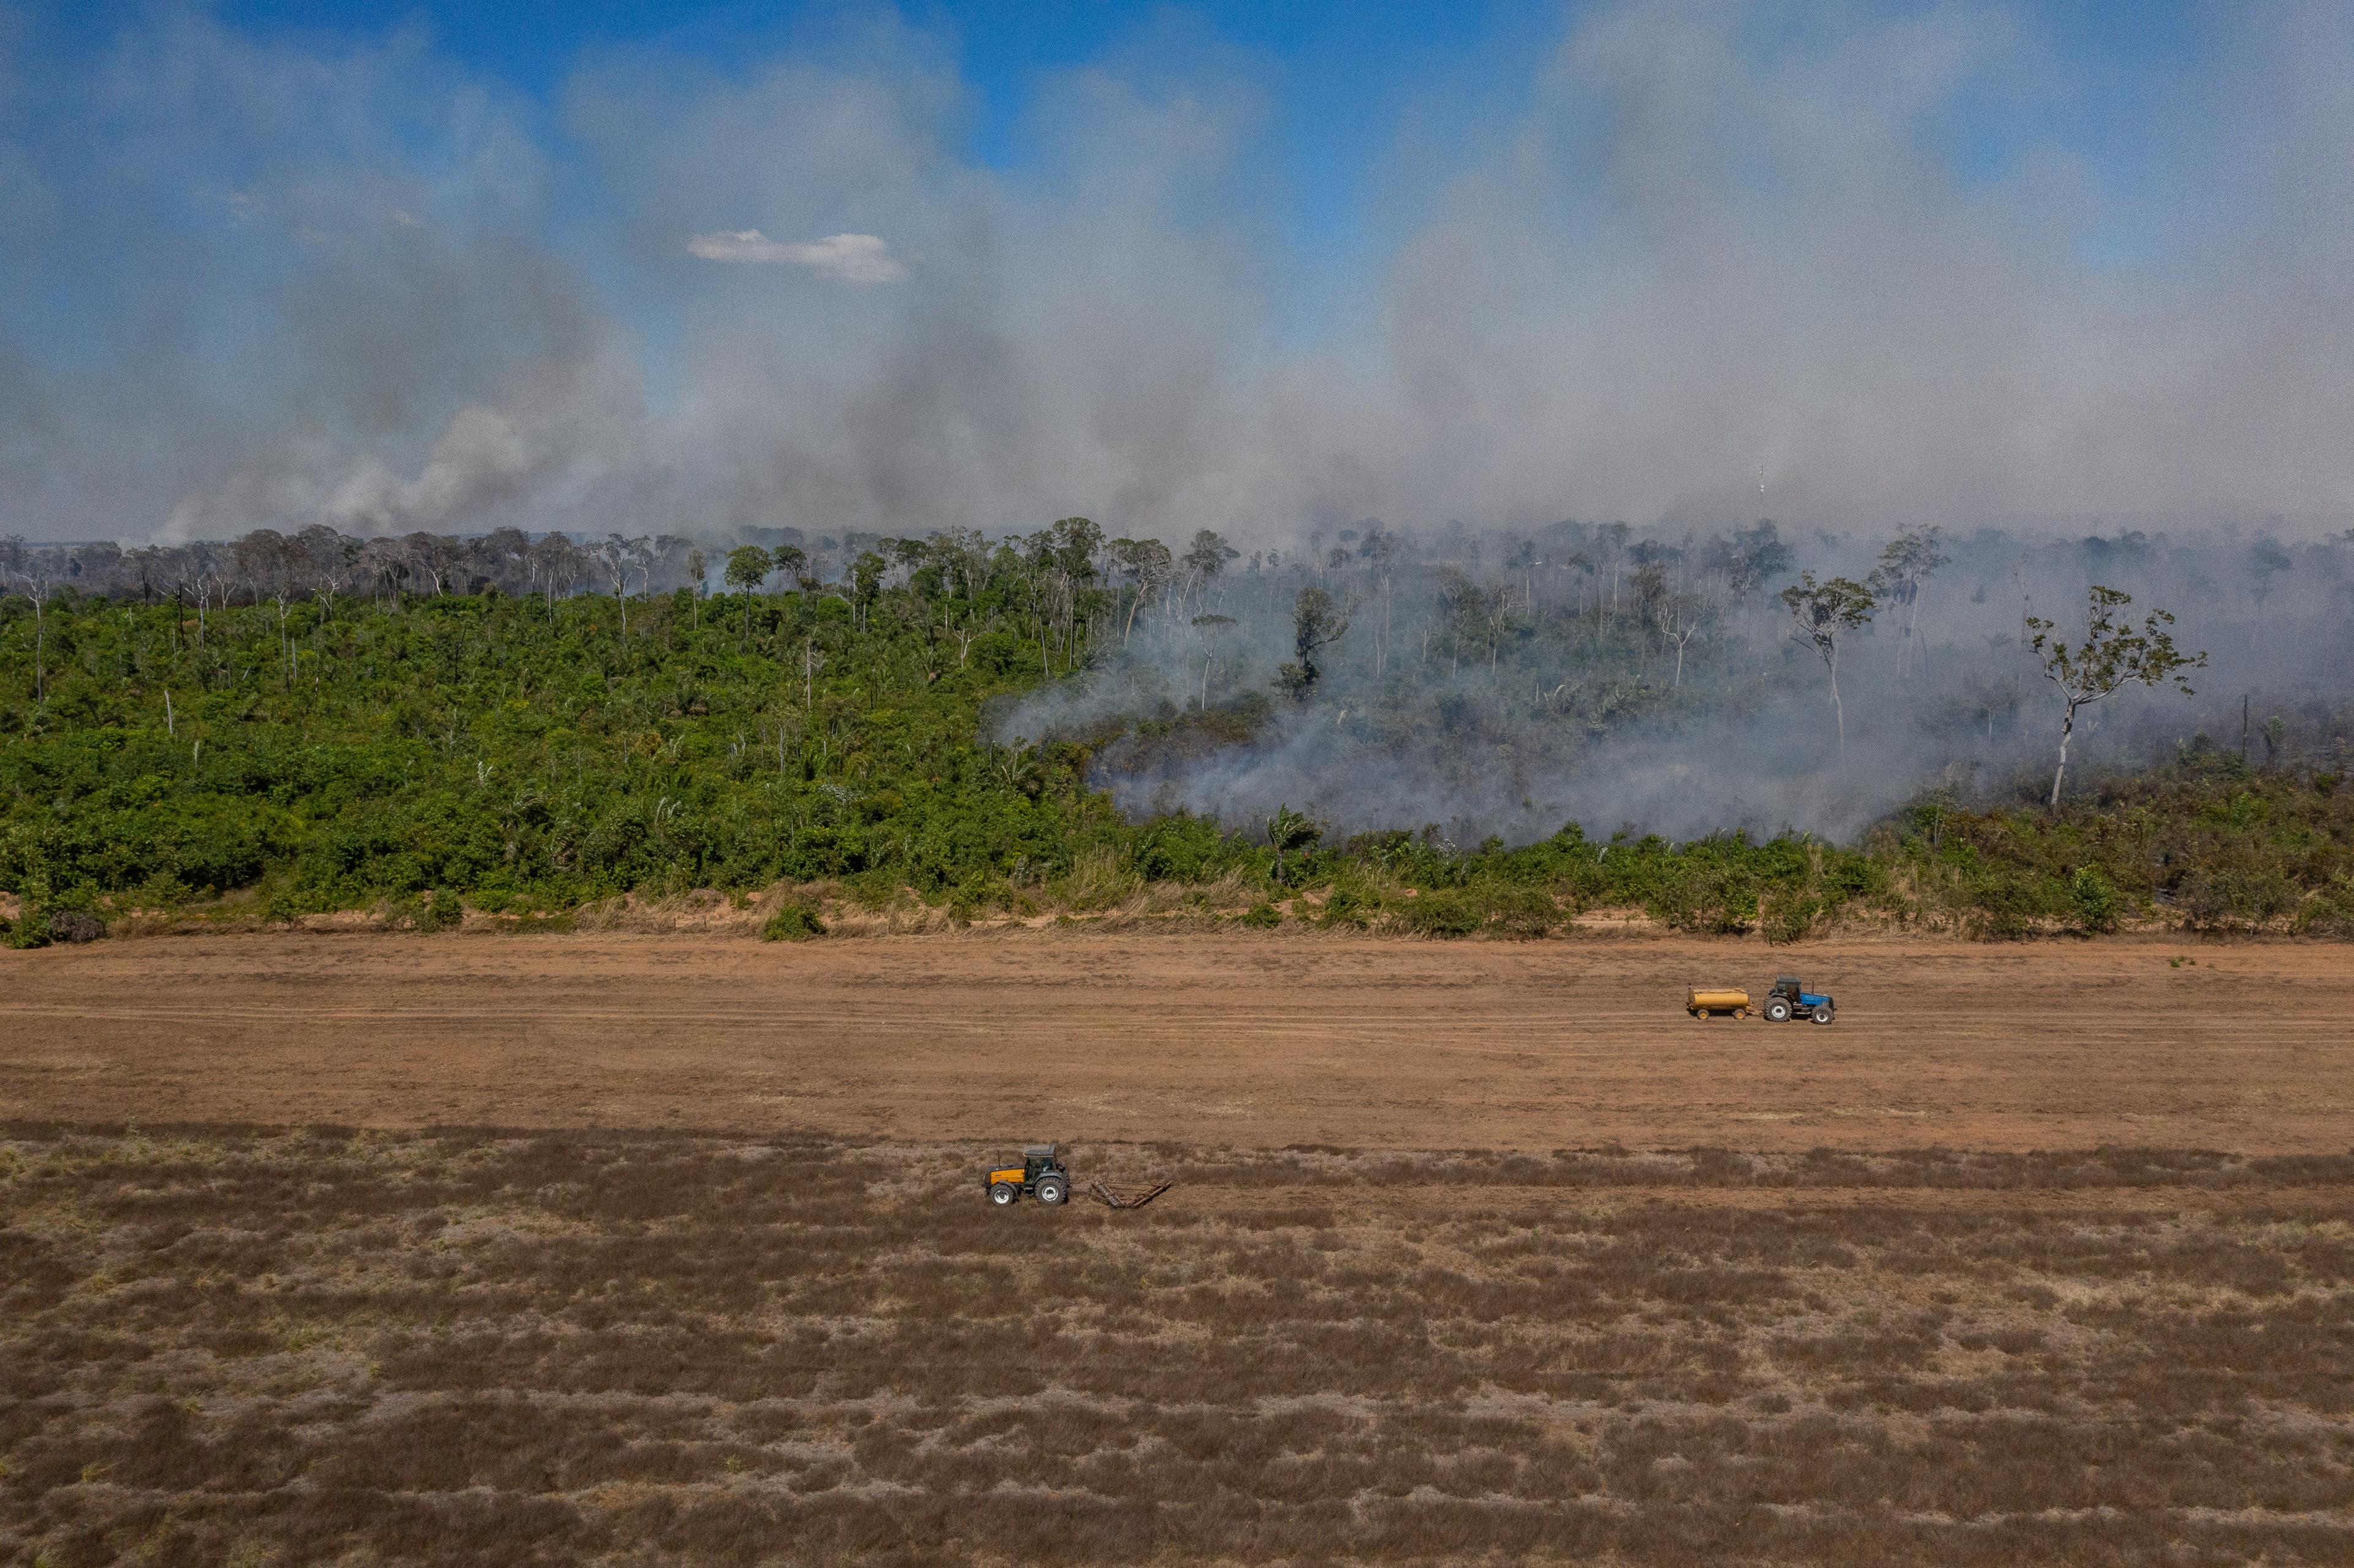
We assess the environmental impacts of producing a commodity using maps of deforestation, commodity production areas and carbon stocks. We attribute these impacts by connecting specific sourcing regions to the companies that buy from them and the countries that import those products.
Our assessments use the highest spatial resolution data available. For example, where plot-level traceability data is available, we directly link the environmental impacts to the specific plot of land. Where data is available only at the jurisdictional or country level, as in many of Trase's supply chain datasets, deforestation and associated emissions are allocated to companies and importing countries according to their sourced volumes from the producing jurisdictions or country. In these cases, we refer to deforestation exposure, reflecting environmental impacts embedded in supply chains rather than impacts directly attributable to a specific actor.
We complement our spatial assessment by providing additional information on total deforestation in a geographic area (whether or not linked to a commodity), production area, volume, yields and value, and supplement the analysis with information about a company’s sustainability commitments following guidance from Global Canopy’s Forest 500 methodology.
Global supply chain mapping: This approach shows international trade between countries of production, import and consumption. Trase uses direct and re-export adjusted trade data, and consumption-based accounting (further details here).
Direct trade: The simplest approach to commodity trade analysis. We use international trade records from the UN Food and Agriculture Organization (FAO) or UN Comtrade.
Re-export adjusted trade: Agricultural commodity supply chains often involve multiple processing steps in different countries before they reach their final destination for consumption. In addition to direct international trade records, the re-export adjusted method uses FAO data on the processing and trade of derived commodities to factor in intermediate steps in the supply chain .
Consumption-based accounting: The Input-Output Trade Analysis (IOTA) modelling framework uses monetary Multi-Regional Input-Output (MRIO) data combined with commodity agricultural production, processing and trade data to estimate how different economic sectors link to each other and to international commodity trade and production. MRIO modeling is an economic approach which tracks financial flows between countries’ major economic sectors. The result is an estimate of agricultural commodity supply chains from production to consumption centers.
Do Pasto ao Prato (DPaP) is Trase's sister initiative, a mobile application increasing transparency in the Brazilian domestic market for beef. It uses a bottom-up mapping approach to allow Brazilian consumers to identify the origin of the beef available in supermarkets. By utilising crowdsourced subnational data, the app connects meat retailers to the specific meat processing plants and municipalities where the cattle were raised. To assess these supply chains, the app evaluates each slaughterhouse based on five sets of indicators: the audited performance of their sustainable supply chain commitments, deforestation, and the occurrence of fires within their supply zones, their sanitary and animal welfare performance, and possible cases of slave labor among their suppliers.
We attribute deforestation and associated greenhouse gas emissions to companies and countries by linking their commodity sourcing regions identified in their supply chains to the environmental impacts of commodity production within those regions. Our assessments use the highest spatial resolution supported by the available data.
For example, when we have full traceability to plot-level or concession of production, and spatially explicit commodity attributed deforestation and greenhouse gas emissions data, we directly attribute the deforestation and emissions occurring on the production area to the companies and countries along the supply chain. Trase uses this approach for its wood-pulp supply chains.
More commonly, production can be traced to a jurisdiction (such as a municipality, district or province), or country rather than to individual farms or concessions. In these cases, we attribute the deforestation and emissions observed within that jurisdiction or country to those companies or countries in proportion to the volume they source from that jurisdiction. The resulting estimates are referred to as deforestation and emissions exposure, reflecting the environmental impacts embedded in supply chains rather than the directly observed impacts attributable to a specific actor. We use this approach across our soy, beef, palm and cocoa supply chain assessments, and for linking our DeDuCE data to global trade supply chain data.
Global impact metrics: At the global scale, we use the Deforestation Driver & Carbon Emissions (DeDuCE) model, offering a globally homogenous and comprehensive assessment of deforestation and carbon emissions linked to over 180 commodities across more than 180 countries. It combines tree cover loss, land use and commodity maps, as well as dominant tree cover loss data derived from satellite imagery with statistical land-use data to attribute deforestation to specific agricultural commodities. Aiming for global comparability, DeDuCE deforestation data builds on Global Forest Change datasets, offering global deforestation mapping.
Subnational impact metrics: At subnational level, we aim to use the best available regional data for each country-commodity context tailoring our impact metrics to maximize regional representation and contextual relevance. For example, for Brazil we combine PRODES and MapBiomas deforestation data leveraging producing countries own data products for the assessment. For Indonesia we use data developed by The Treemap, providing the most accurate and up-to-date estimates of commodity driven deforestation. For cocoa deforestation, we employ the Tropical Moist Forest (TMF) dataset, including forest degradation, to ensure representation of the impact of shade grown cocoa, often mapped as degraded forests, rather than deforestation.
Carbon is stored as biomass in natural ecosystems (e.g. forests, savannahs, grasslands), as well as in mineral soils and peatlands. Once the biomass of terrestrial natural ecosystems is cleared or peatlands are drained to convert to cropland, pasture or plantations, greenhouse gas emissions are released into the atmosphere, accelerating climate change.
Gross greenhouse gas (gross GHG) emissions refers to the amount of carbon removed (in CO2-eq per year) released following the conversion of natural ecosystems in cropland, plantation or pasture without accounting for the biomass accumulated by the new land use through carbon sequestration. In contrast, net GHG emissions consider the carbon accumulated in the new land use through sequestration which are subtracted from the gross GHG emissions.
The Greenhouse Gas Protocol released in early 2026 specifies standards for companies in the forestry, land and agricultural sector about how to account for greenhouse gas emissions from land-use change. One of the key characteristics of this guidance is the 20-year land-use change assessment period (Greenhouse Gas Protocol Land Sector and Removals Standard, 2026).
Differences in the definition of what constitutes a forest impacts the outcome of any deforestation assessment.
Global forest definition: Our global DeDuCE model defines a forest as woody vegetation exceeding five meters in height with at least a 25% tree cover threshold.
Subnational forest definition: Within our subnational contexts we use an inclusive definition, categorizing forest as all native vegetation, meaning it encompasses standard forests, savannahs and grasslands. We aim to use best regionally and commodity representative datasets like Prodes and MapBiomas for Brazil, data developed by The TreeMap for Indonesia, and Tropical Moist Forest data developed by the Joint research Center of the European commission for Côte d'Ivoire.
Attributing deforestation to a specific commodity is challenging because land is often cleared before planting, land use may only become visible in satellite imagery after a delay, and crop maps are not always available to directly observe conversion.
To address these challenges, we use peer-reviewed spatial and statistical attribution methods. Spatial attribution links deforestation to subsequent commodity expansion using deforestation and commodity maps, while statistical attribution allocates deforestation based on changes in crop area and production where spatial data are unavailable or incomplete. The approach and timeframe vary by commodity and data availability.
Global deforestation attribution: The DeDuCE model combines spatial and statistical attribution, prioritising spatial attribution where suitable data are available. Spatial attribution typically links crop expansion occurring within three years of a deforestation event to the clearing. Statistical attribution allocates deforestation according to observed crop expansion dynamics derived from agricultural statistics.
Subnational deforestation attribution:
- Palm and wood pulp: Deforestation is attributed within a one-year window following clearing. This reflects the rapid conversion of forest to plantation, which can often be detected in satellite imagery shortly after deforestation.
- Soy and pasture (cattle/beef): Deforestation is attributed within five years of clearing to account for the time required for land preparation, establishment of production and reliable identification of land use from satellite data.
- Cocoa (Côte d’Ivoire & Ghana): Deforestation is assessed by directly overlaying deforestation data with mapped cocoa-growing areas.
Commodity-driven deforestation and emissions: This describes the physical conversion of native vegetation into agricultural land. It is based on the year the deforestation event occurred and is often used by governments for prioritizing local policy interventions.
Commodity-attributed deforestation and emissions: This tracks the environmental impact embedded in the actual product being sold (tied to the harvest year). This factors in the time lag between when the land was cleared, when the crop was planted, and when it was finally harvested. Additionally, in our subnational mapping, we look at long-term historical impacts by reporting the five, and ten-year cumulative deforestation embedded in the harvest.
The lag times differ significantly by commodity:
- Beef: Immediate (we assume cattle can roam deforested land immediately).
- Soybeans: One-year lag.
- Palm: Three-year lag.
- Cocoa: Four-year lag.
- Wood-pulp: Six-year lag.
Amortization means spreading the impact of a deforestation event or GHG emissions over multiple years of commodity production. Because land that is cleared once continues to be agriculturally productive over multiple years, it is common to attribute a fraction of this deforestation to multiple harvests, rather than placing 100% of the impact on the very first harvest. Trase typically uses a five-year amortization period.
We assess companies using the same method as Global Canopy’s Forest 500. We assess companies using information published on their websites in the year for which they are being assessed. We report companies as having a zero-deforestation commitment if they have a commitment to ‘deforestation-free sourcing’, understood as no loss of natural forests anywhere. Companies only committing to zero net deforestation, understood as a commitment to offset forest loss through forest restoration or companies trading deforestation-free certified, without providing indication of their corporate commitment to zero deforestation do not score for this indicator. A company cannot only aim to ‘reduce or avoid deforestation’.
To create our facilities datasets, we compile geolocated records of facilities using a combination of official government registries, corporate disclosures and advanced satellite mapping:
- Brazil (soy and livestock): We merge data from federal and state sanitary inspection systems (such as SIF, SIE, SIM, and SISBI-POA) to see which slaughterhouses are legally authorized to sell and export products. To find unlisted facilities, we use machine learning tools applied to satellite embeddings, such as the AlphaEarth foundation model, which our analysts then verify.
- Côte d'Ivoire (cocoa): We use public disclosures from trading and manufacturing companies and external accountability maps. When geographic data is missing, we conduct online searches to match town or city names embedded within a cooperative's name to map it to a specific administrative department.
- Indonesia (pulp & palm): We compile pulp wood concessions using official Forest Utilization Licenses spatial dataset and government wood supply plans. Pulp mills are compiled using information from the government wood supply plans and corporate sustainability reports. The palm oil mill list is built off the Universal Mill List and updated using information disclosed by companies or the government, such as certification reports, mill supplier lists, plantation statistics documents and corporate sustainability reports. Palm oil refineries are mapped via desk-based research.
When official capacities are not publicly reported, we use data estimation techniques. For example, for Brazilian soy facilities without declared storage capacities, we calculate the average capacity from known facilities and apply it as a baseline. For Côte d'Ivoire cocoa, we estimate a cooperative’s minimum farmer base by adding up the sizes of disclosed supply links from corporate buyers, sometimes relying on historical data or Monte Carlo estimates to fill in missing years.
We associate individual facilities to their parent companies or corporate groups by reviewing corporate sustainability reports, audited financial documents and official corporate registries. We also use data enrichment AI tools to retrieve local tax IDs and resolve ambiguities between a facility's informal trading name and its formal corporate legal title.
References
- Bourgoin, C. et al. (2025) “Global map of forest cover 2020 - version 3.” Available at: http://data.europa.eu/89h/8c561543-31df-4e1b-9994-e529afecaf54.
- Brown, C.F. et al. (2025). AlphaEarth Foundations: An embedding field model for accurate and efficient global mapping from sparse label data. arXiv.
- Clay (2025). Clay Foundation Model.
- CONAB (2025). SICARM: Sistema de Cadastro Nacional de Unidades Armazenadoras. Companhia Nacional de Abastecimento (CONAB).
- Croft, S.A., West, C.D., & Green, J.M., 2018. Capturing the heterogeneity of sub-national production in global trade flows. Journal of Cleaner Production, 203, 1106-1118.
- Curtis, P.G. et al. (2018) “Classifying drivers of global forest loss,” Science, 361(6407), pp. 1108–1111. Available at: https://doi.org/10.1126/science.aau3445.
- Fitts, L.A. et al. (2025) Geospatial Methods for Corporate GHG Accounting of Deforestation and Land Occupation: Guidebook. Washington, DC: World Resources Institute. Available at: https://doi.org/10.46830/wrigb.22.00158.
- Fitts, L.A. et al. (2025) “Statistical Land Use Change Emissions from Deforestation and Land Occupation for Crops.” Washington, DC: World Resources Institute. Available at: https://doi.org/10.46830/writn.25.00085.
- Food and Agriculture Organization of the United Nations (2020) Global Forest Resources Assessment 2020: Terms and Definitions. Rome: FAO. Available at: https://fra-data.fao.org/definitions/fra/2020/en/tad.
- Gaveau, D.L.A. et al. (2019) “Rise and fall of forest loss and industrial plantations in Borneo (2000–2017),” Conservation Letters, 12(3), p. e12622. Available at: https://doi.org/10.1111/conl.12622.
- Gaveau, D.L.A. et al. (2021) “Forest loss in Indonesian New Guinea (2001–2019): Trends, drivers and outlook,” Biological Conservation, 261, p. 109225. Available at: https://doi.org/10.1016/j.biocon.2021.109225.
- Gaveau, D.L.A. et al. (2022) “Slowing deforestation in Indonesia follows declining oil palm expansion and lower oil prices,” PLOS ONE. Edited by R. Zang, 17(3), p. e0266178. Available at: https://doi.org/10.1371/journal.pone.0266178.
- Gibbs, H.K. et al. (2015) “Brazil’s Soy Moratorium,” Science, 347(6220), p. 377. Available at: https://doi.org/10.1126/science.aaa0181.
- Godar, J., Persson, U.M., Tizado, E.J., Meyfroidt, P., 2015. Towards more accurate and policy relevant footprint analyses: Tracing fine-scale socio-environmental impacts of production to consumption. Ecological Economics, 112, 25–35. https://doi.org/10.1016/j.ecolecon.2015.02.003
- Graesser, J. et al. (2015) “Cropland/pastureland dynamics and the slowdown of deforestation in Latin America,” Environmental Research Letters, 10(3), p. 034017. Available at: https://doi.org/10.1088/1748-9326/10/3/034017.
- Graesser, J., Ramankutty, N. and Coomes, O.T. (2018) “Increasing expansion of large-scale crop production onto deforested land in sub-Andean South America,” Environmental Research Letters, 13(8), p. 084021. Available at: https://doi.org/10.1088/1748-9326/aad5bf.
- Greenhouse Gas Protocol (2026) Land Sector and Removals Standard. Version 1.0. Geneva / Washington, D.C.: World Resources Institute (WRI) and World Business Council for Sustainable Development (WBCSD). Available at: https://ghgprotocol.org/sites/default/files/2026-01/Land-Sector-and-Removals-Standard.pdf.
- Guye, V., (2024). Ivorian Cocoa Cooperatives and their Buyers (IC2B) – database v1.0. Open Data @ UCLouvain.
- INPE (2025) “Prodes – Annual Monitoring of Native Vegetation Suppression – Amazon/Cerrado/Pantanal/Caatinga/Atlantic Forest/Pampa.” Available at: https://terrabrasilis.dpi.inpe.br/downloads/ (Accessed: September 6, 2025).
- Lathuillière, M.J. et al. (2025) “Complementary Perspectives and Metrics Are Essential to End Deforestation,” Conservation Letters, 18(5), p. e13145. Available at: https://doi.org/10.1111/conl.13145.
- Lenzen, M., Geschke, A., Abd Rahman, M.D., Xiao, Y., Fry, J., Reyes, R., Dietzenbacher, E., Inomata, S., Kanemoto, K., Los, B., Moran, D., Schulte in den Bäumen, H., Tukker, A., Walmsley, T., Wiedmann, T., Wood, R., & Yamano, N., 2017. The Global MRIO Lab - charting the world economy. Economic Systems Research, 29, 158-186.
- MapBiomas (no date) “Annual Land Use Land Cover Maps of Brazil.” Available at: https://brasil.mapbiomas.org/.
- MapBiomas (2025) “MapBiomas Project - Collection 10 of the Annual Land Use Land Cover Maps of Brazil.” Available at: https://brasil.mapbiomas.org/ (Accessed: September 6, 2025).
- Mighty Earth (2021). Cocoa Accountability Map (Version 3.0).
- Ministry of Forestry (MoF), Government of Indonesia (2025). Rencana Pemenuhan Bahan Baku Industri, RPBBI.
- Morton, D.C. et al. (2006) “Cropland expansion changes deforestation dynamics in the southern Brazilian Amazon,” Proceedings of the National Academy of Sciences, 103(39), pp. 14637–14641. Available at: https://doi.org/10.1073/pnas.0606377103.
- Pendrill, F. et al. (2022) “Disentangling the numbers behind agriculture-driven tropical deforestation,” Science, 377(6611), p. eabm9267. Available at: https://doi.org/10.1126/science.abm9267.
- Renier, C., Vandromme, M., Meyfroidt, P., Ribeiro, V., Kalischek, N., Ermgassen, E.K.H.J.Z., 2023. Transparency, traceability and deforestation in the Ivorian cocoa supply chain. Environ. Res. Lett. 18, 024030. https://doi.org/10.1088/1748-9326/acad8e
- Sims, M. et al. (2024) “Global drivers of forest loss at 1 km resolution.” Computer Sciences. Available at: https://doi.org/10.31223/X5HQ6K.
- Song, X.-P. et al. (2021) “Massive soybean expansion in South America since 2000 and implications for conservation,” Nature Sustainability, pp. 784–792. Available at: https://doi.org/10.1038/s41893-021-00729-z.
- Souza, C.M. et al. (2020) “Reconstructing Three Decades of Land Use and Land Cover Changes in Brazilian Biomes with Landsat Archive and Earth Engine,” Remote Sensing, 12(17), p. 2735. Available at: https://doi.org/10.3390/rs12172735.
- Stadler, K., Wood, R., Bulavskaya, T., Södersten, C.J., Simas, M., Schmidt, S., Usubiaga, A., Acosta-Fernández, J., Kuenen, J., Bruckner, M., Giljum, S., et al., 2018. EXIOBASE 3: Developing a Time Series of Detailed Environmentally Extended Multi-Regional Input-Output Tables. Journal of Industrial Ecology, 22, 502-515.
- Vancutsem, C. et al. (2021) “Long-term (1990–2019) monitoring of forest cover changes in the humid tropics,” Science Advances, 7(10), p. eabe1603. Available at: https://doi.org/10.1126/sciadv.abe1603.
- zu Ermgassen, Erasmus K. H. J. et al. (2020) “The origin, supply chain, and deforestation risk of Brazil’s beef exports,” Proceedings of the National Academy of Sciences, 117(50), pp. 31770–31779. Available at: https://doi.org/10.1073/pnas.2003270117.
- zu Ermgassen, Erasmus K H J et al. (2020) “Using supply chain data to monitor zero deforestation commitments: an assessment of progress in the Brazilian soy sector,” Environmental Research Letters, 15(3). Available at: https://doi.org/10.1088/1748-9326/ab6497.