Analysis

Focus on deforestation obscures wider risks to biodiversity

3 May 2023
4 min read

Policymakers and businesses should develop new biodiversity risk indicators to better protect nature from the expansion of agricultural commodity production, Trase research finds.
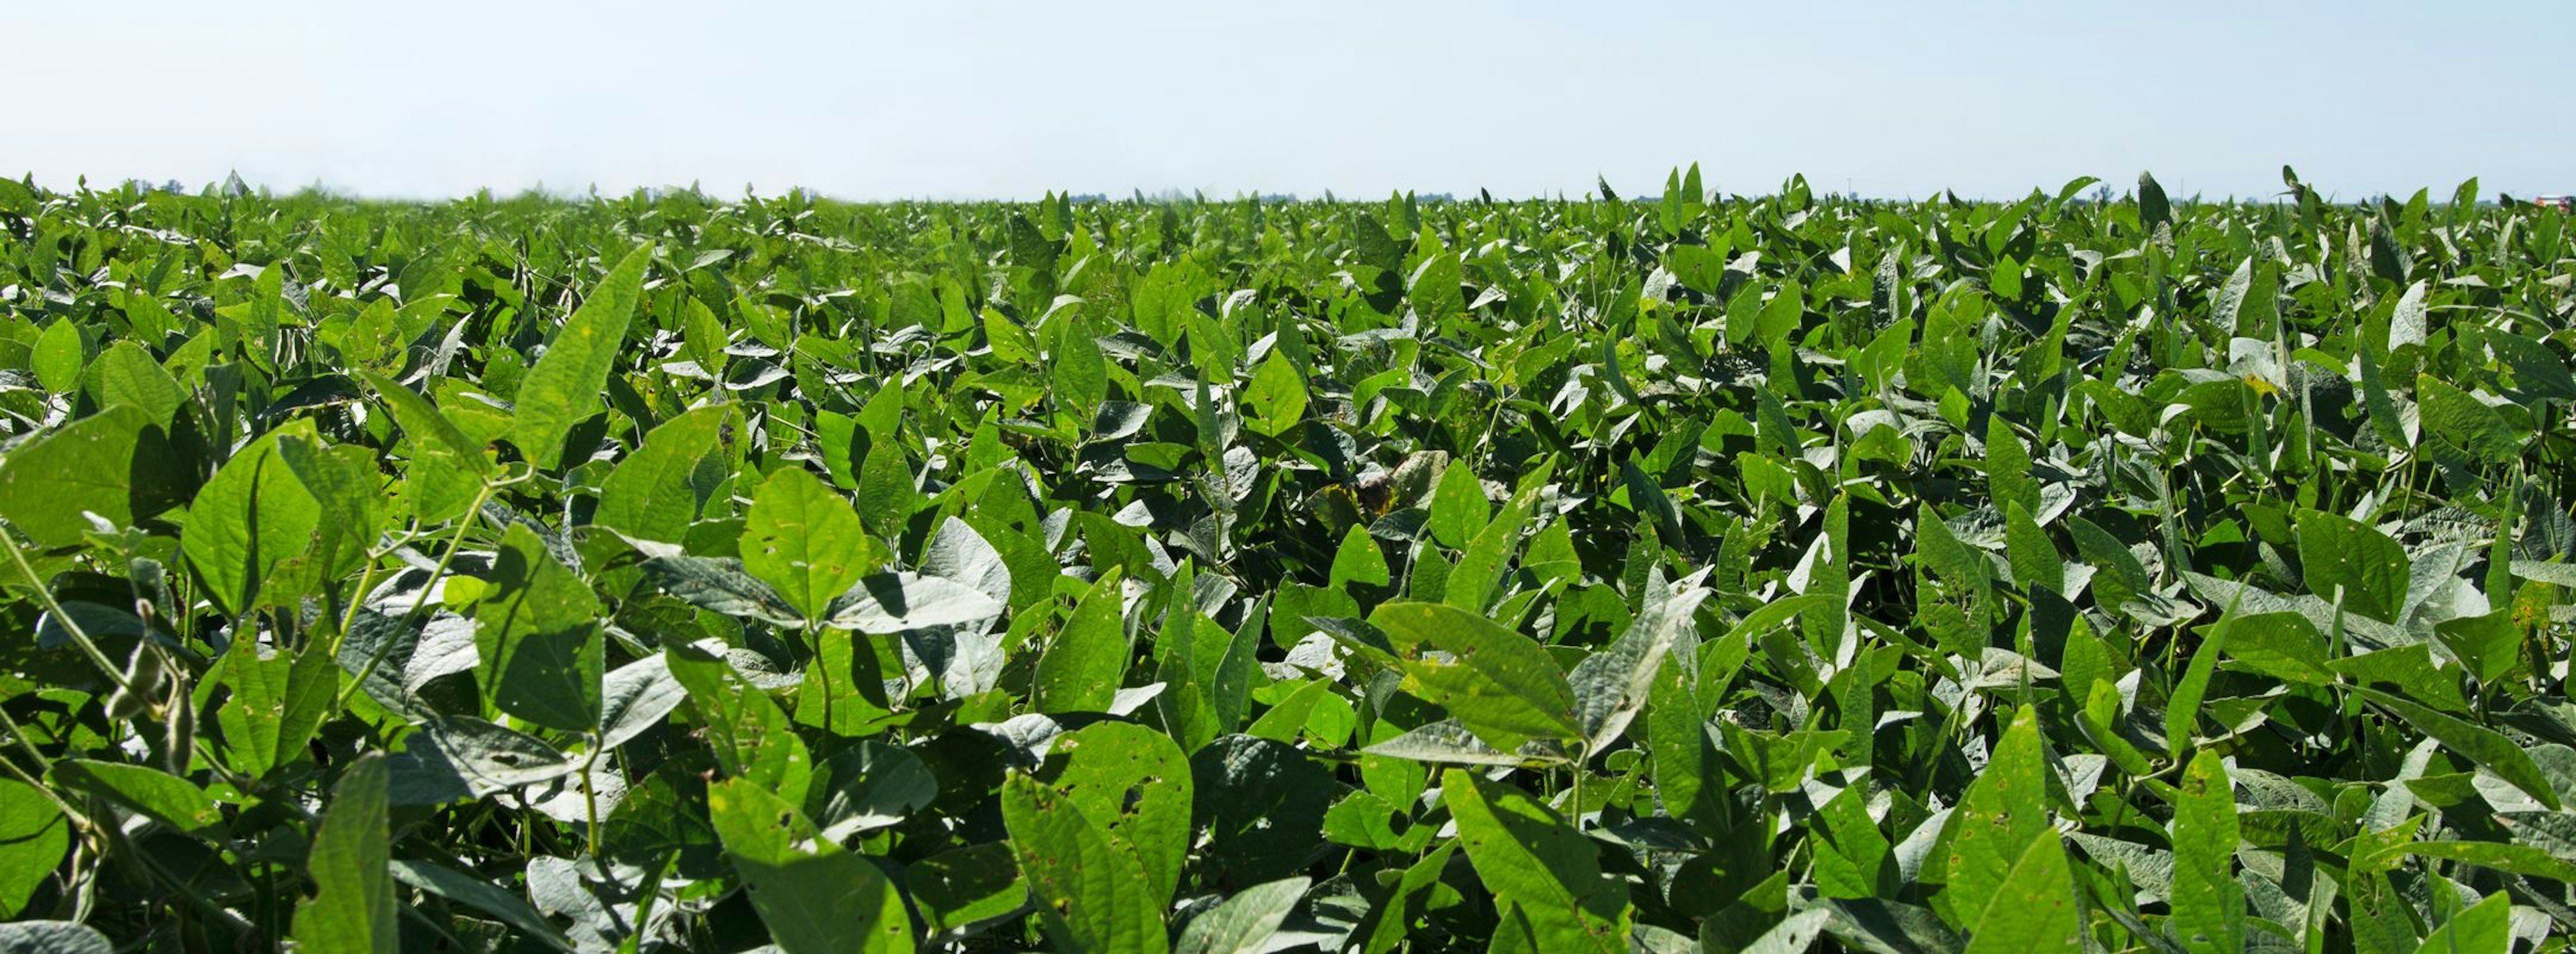
Argentina soy

A soy plantation in Santa Fe province, Argentina (Jopstock/Adobe Stock)

Increasing global demand for beef, soy and palm oil is driving the expansion of plantations into natural habitats resulting in a catastrophic loss of animal and plant species in tropical countries such as Brazil and Indonesia. Approximately 80% of all threatened terrestrial mammal and bird species are affected by agriculturally driven habitat loss.

The EU and UK recently agreed legislation to reduce deforestation associated with imported commodities. These regulations aim to tackle biodiversity loss by requiring businesses to undertake due diligence on their supply chains to demonstrate they are deforestation-free. While this is an important step forward in protecting tropical forests, the legislation lacks measures to prevent the loss of other ecosystems such as savannahs and grasslands which contain valuable biodiversity.

For a more holistic approach to supply chain impact assessments, it is essential to understand how deforestation relates to other indicators of biodiversity loss. By using supply chain data, Trase and GCRF Trade Hub researchers compared different indicators across key areas of soy production in South America. These risks were then visualised on a map and attributed to companies and countries that trade soy.

Variations in biodiversity risks revealed

For example, the two largest consumers of soy produced in Argentina are the EU and China. When the risks of these supply chains are mapped across the country, there is significant variation between the location of deforestation and other biodiversity impacts such as loss of ‘endemic species’ (species that occur naturally within only one country).

For both countries, deforestation from soy production is concentrated in northern Argentina. In contrast, for the EU the highest potential risks for endemic species occur in the centre of the country, while for China they are concentrated further south within the soy producing areas (see figure).

wildlife biodiversity deforestation

The findings highlight the importance of going beyond deforestation when assessing potential supply chain impacts on biodiversity. For policymakers, focusing on forest loss alone means that other important aspects of biodiversity could remain overlooked and unprotected, even if deforestation-free products legislation is successfully implemented. For companies, the findings highlight the importance of going beyond the mandatory due diligence requirements to include more extensive biodiversity risk indicators in their supply chain impact assessments.

Aside from endemic species, the research assessed three other biodiversity indicators and found variations in how they relate to deforestation. Further research is needed to improve our understanding and use of biodiversity risk indicators by policymakers and businesses. In particular, there is a need to understand more holistically how different indicators of biodiversity risk may be used together in trade-linked risk assessment. Many biodiversity indicators now exist, with varying complexity and levels of commonality in terms of their dependency on underpinning datasets. However, there is a lack of understanding about how the application of different indicators might affect conclusions about which supply chains cause the greatest harm to biodiversity overall, or which indicators in combination provide us with the most robust risk assessments. Ongoing work linked to the Trade Hub will continue to explore these questions.

Read the full Trase research paper: Molotoks, A., Green, J., Ribeiro, V., Wang, Y., & West, C. (2023). Assessing the value of biodiversity-specific footprinting metrics linked to South American soy trade. People and Nature, 00, 1–16. https://doi.org/10.1002/pan3.10457

Was this article useful?

Related insights

See all insights

We use cookies on our site.