A breakthrough in carbon footprinting for agricultural commodities
New study provides detailed breakdown of emissions sources for Brazilian soy exports, with relevance for other agricultural commodities as well as climate policy discussions.
Read in other languages:
English1 Jul 2020
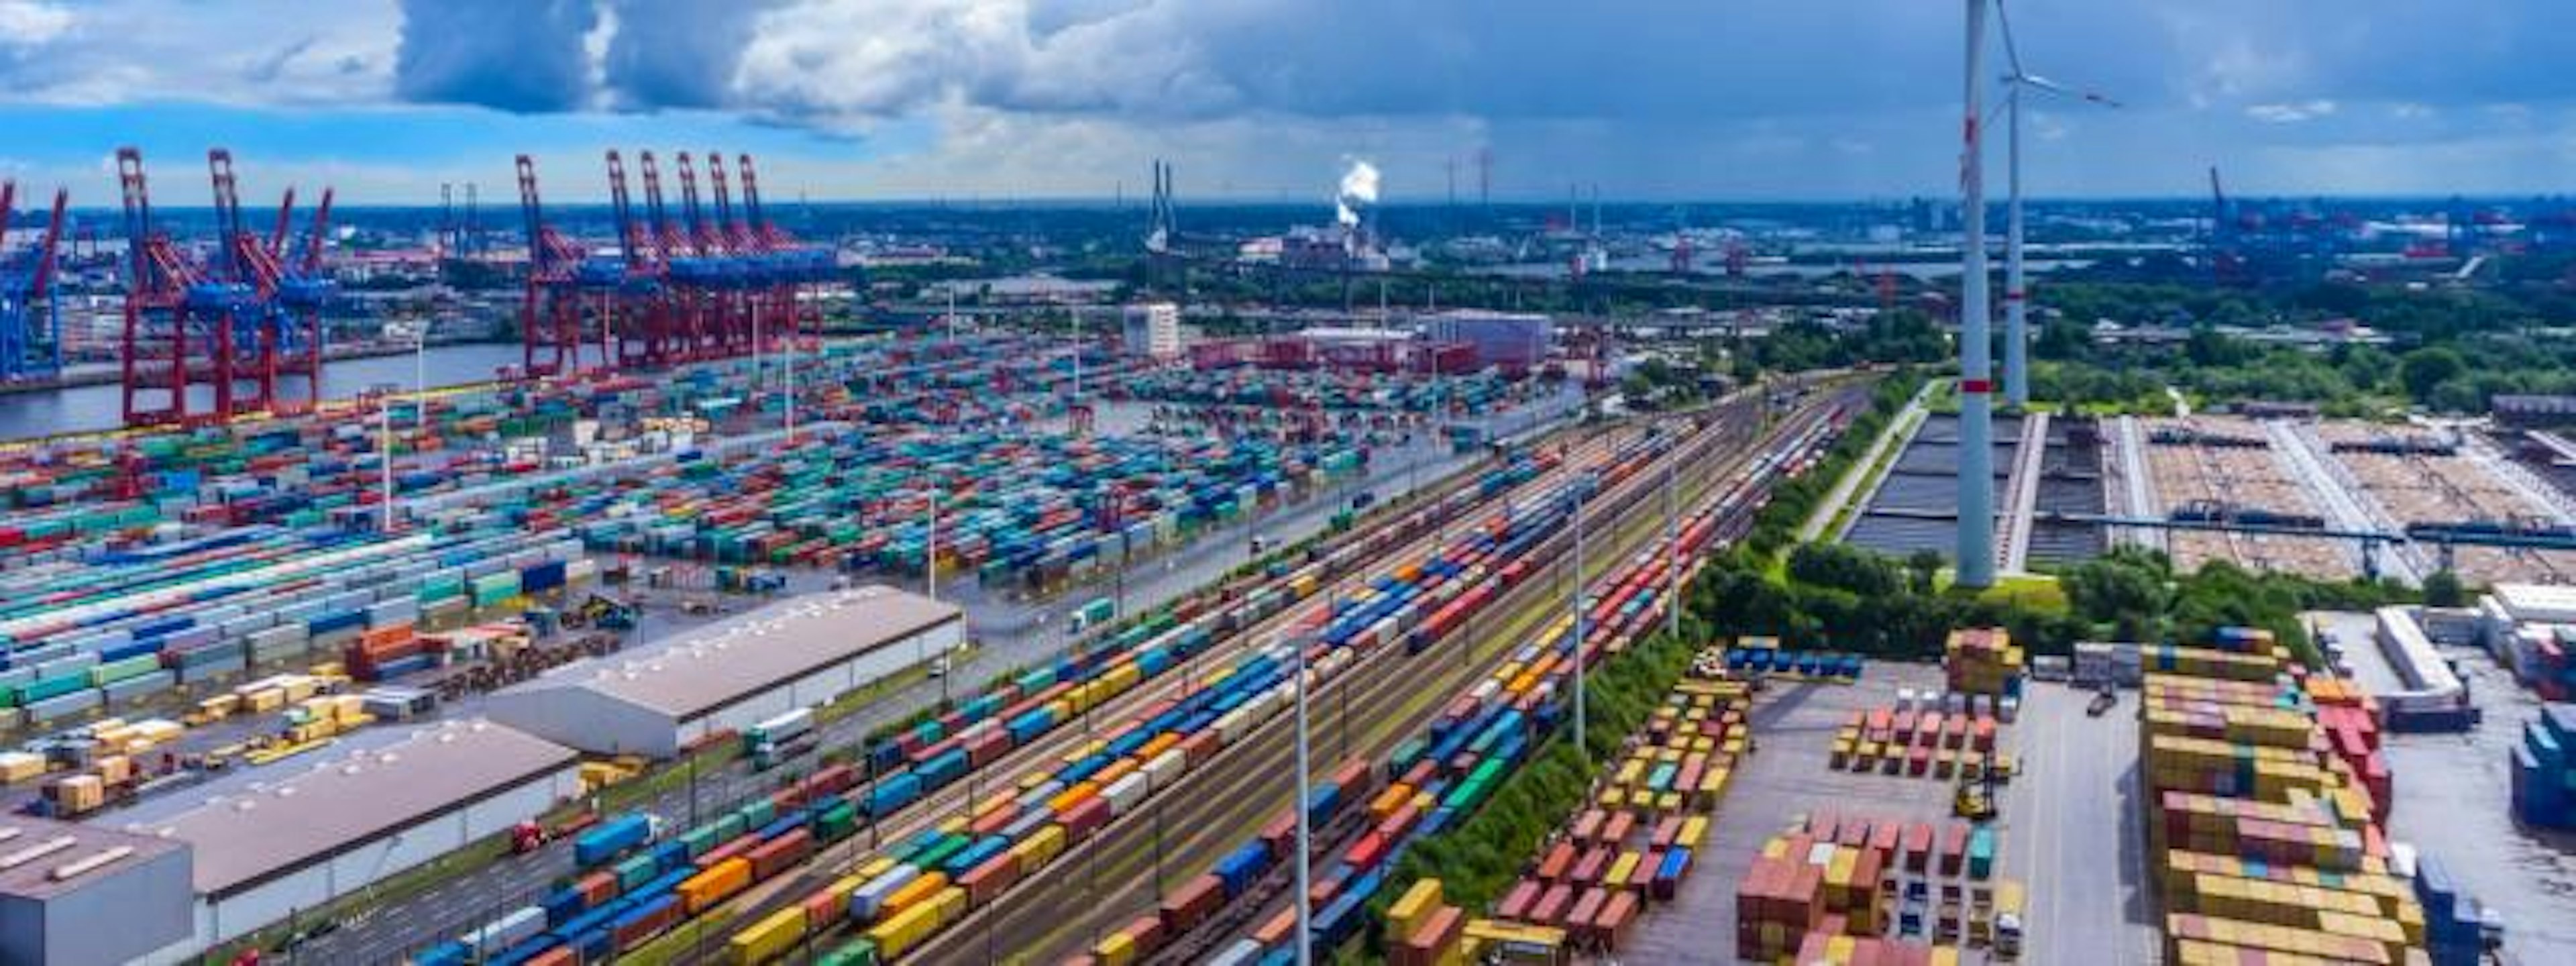
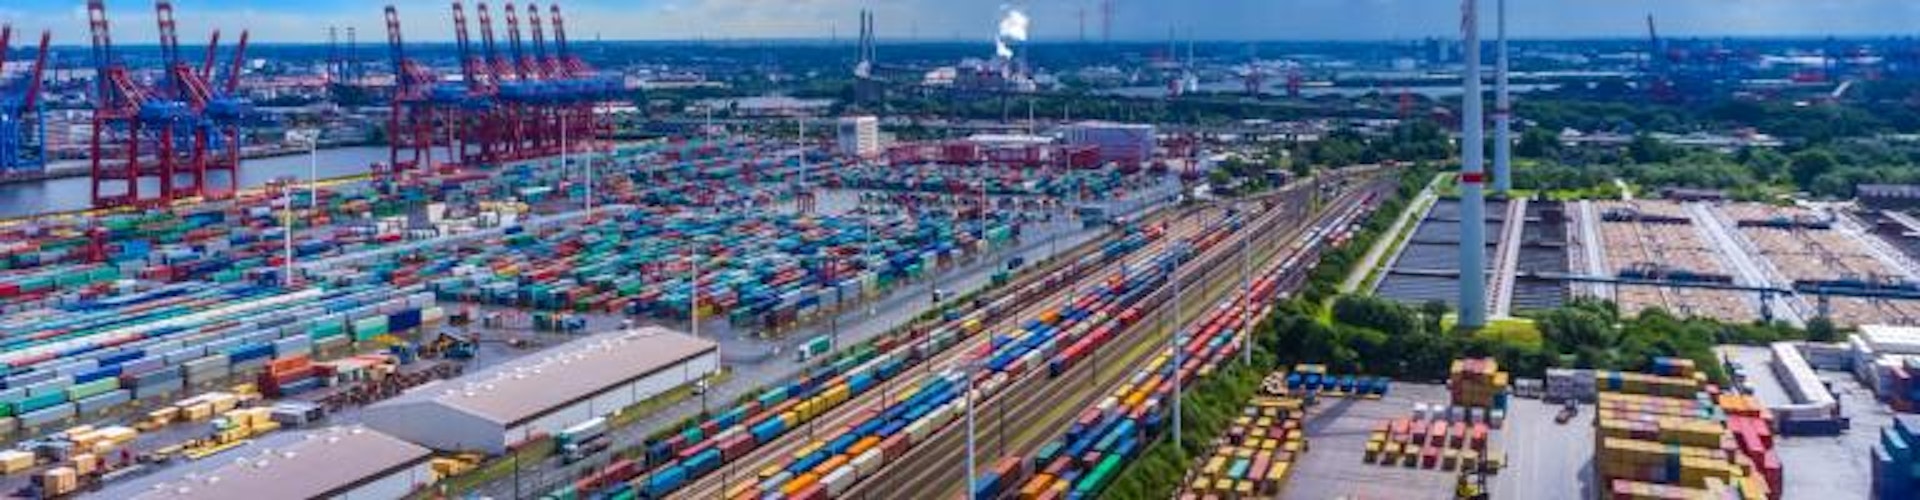
Photo credit: Cargo ship, Credit: Kalyakan / Adobe Stock
New study provides detailed breakdown of emissions sources for Brazilian soy exports, with relevance for other agricultural commodities as well as climate policy discussions.
How big a climate footprint can a soybean or grain of rice amass on its journey from the farm to the consumer? This is a critical question for anyone trying to understand the climate impacts of the globalised food system.
To date, footprinting exercises have almost exclusively relied on crude approximations; on a single estimate of the greenhouse gas (GHG) emissions per tonne of a given agricultural commodity produced in a given country. At best, the figures might vary depending on the country of origin.
A new spatially explicit life-cycle assessment (LCA) approach tailored for globally traded agricultural commodities represents an entirely new class of footprint assessment.
Incorporating Trase data and supply chain maps, it captures inter-regional and supply chain-specific differences in the emissions from land conversion, farming systems, the modes and routes of transport, and industrial processing. These data can then be aggregated across supply chains to assess the footprint of a production region, an importer country or a trading company for an entire year.
Brazilian soy supply chains
The approach has been applied to all Brazilian soy exports between 2010 and 2015. The combination of Trase and other data made it possible to characterise more than 90 000 separate flows of soy, from the producer municipality through to the international import market.
The results were revealing – and underlined the enormous value this approach adds over conventional techniques. For example, they showed that the most emissions-intensive 5% of flows accounted for as much as eight times more GHG emissions per tonne of soy (1.29 tCO2-eq/t) than the 5% least emissions-intensive (0.16 tCO2-eq/t) – differences that would be invisible using current footprinting approaches.
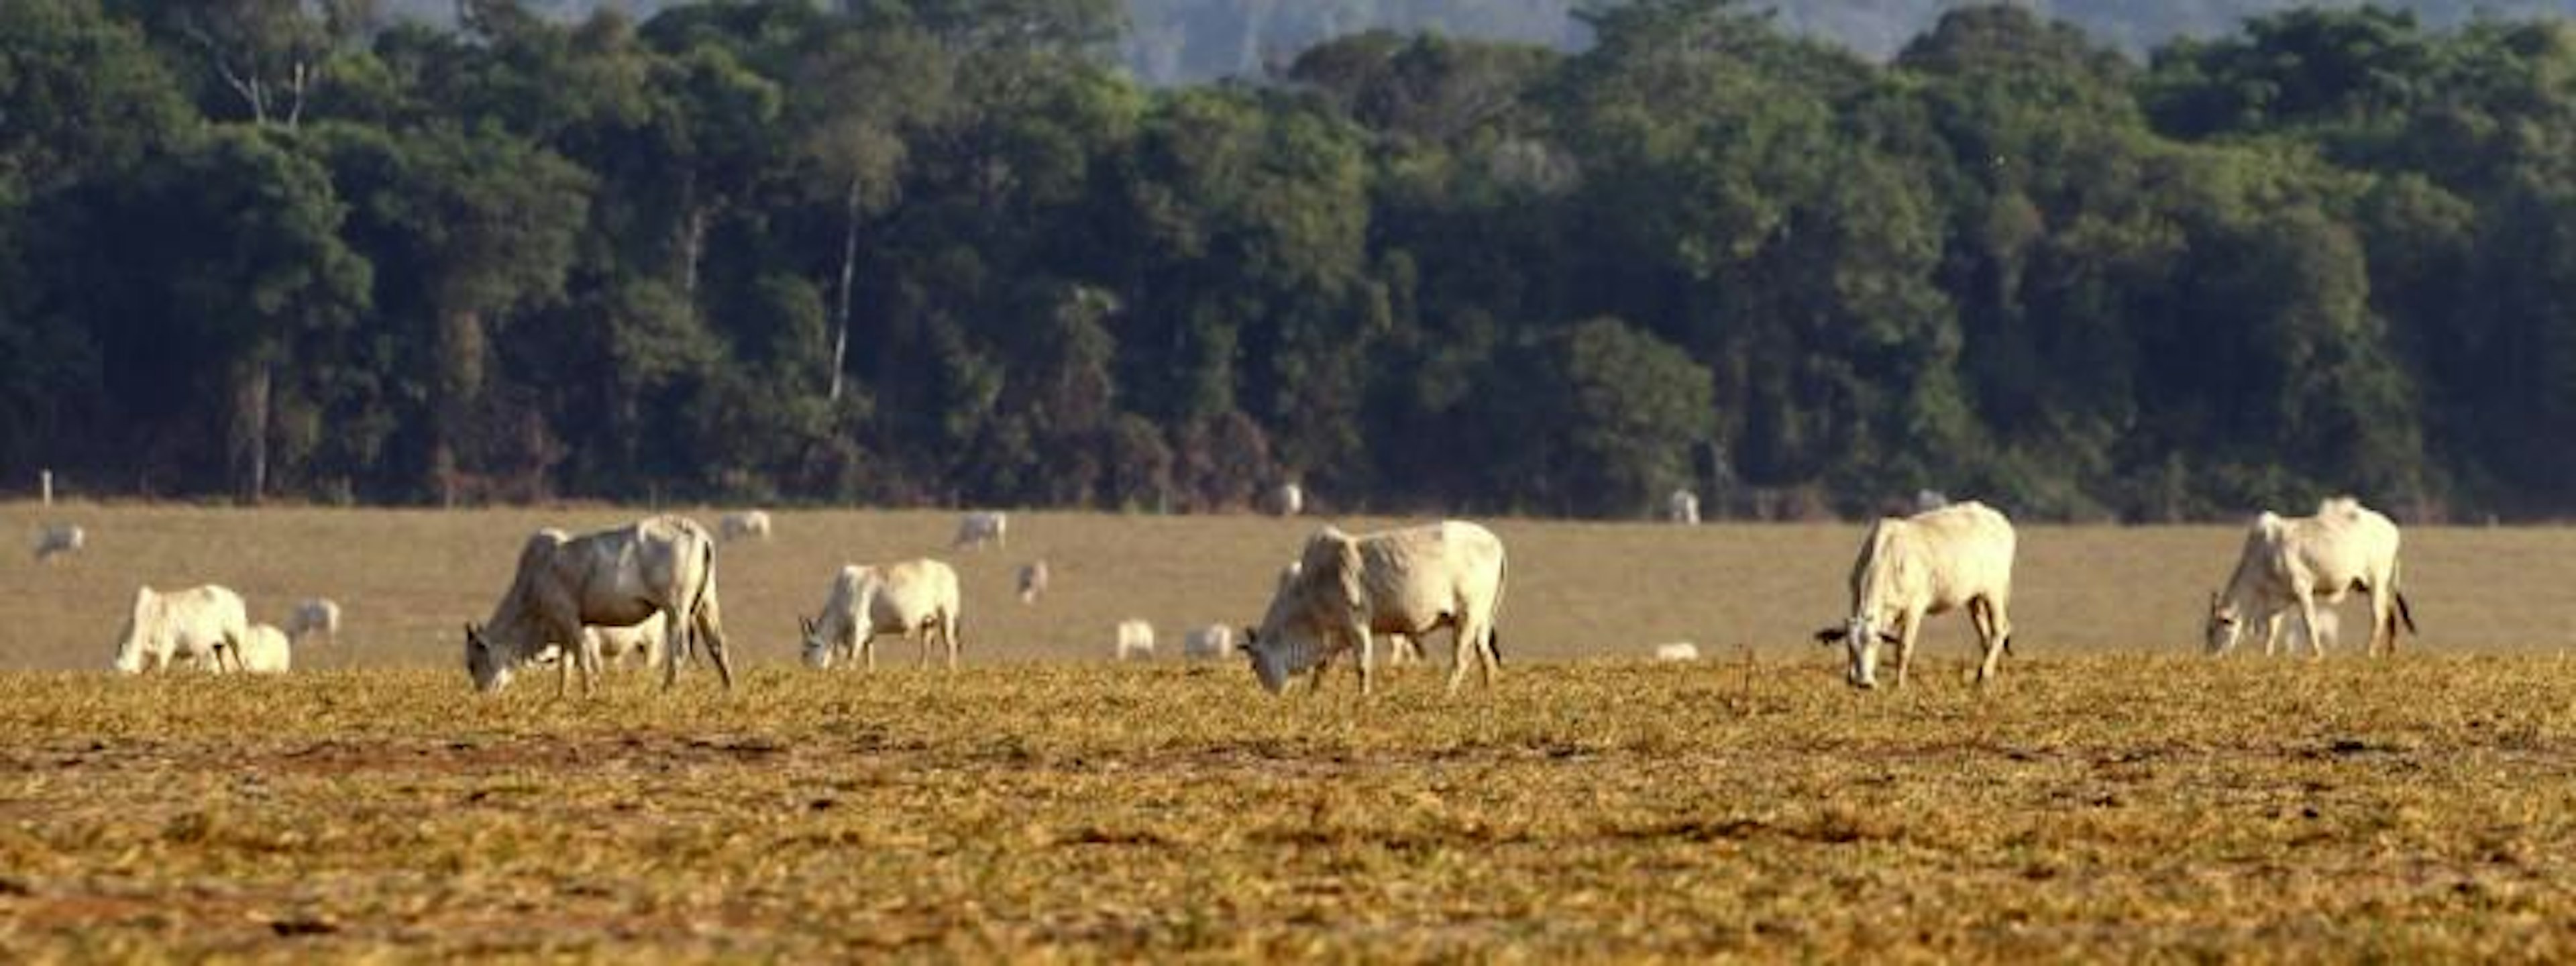
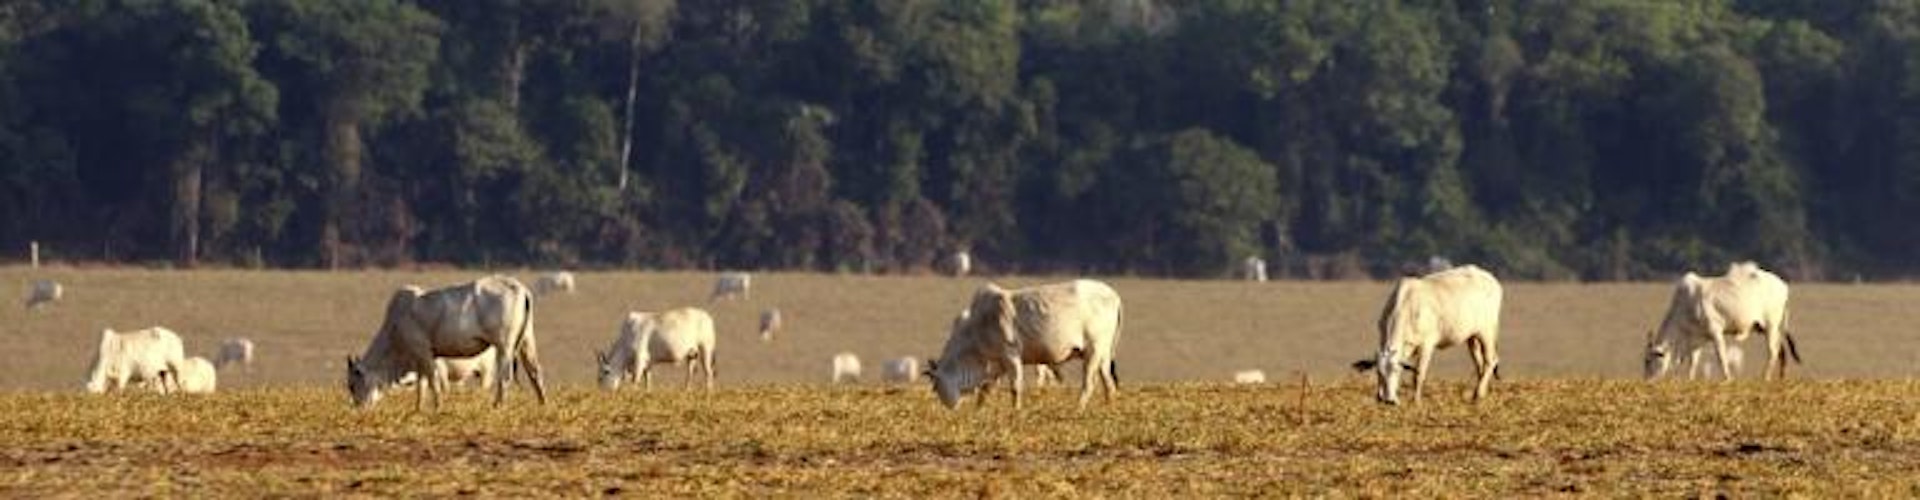
Emissions from land-use change (mostly deforestation) linked to soy production made the biggest difference in emissions intensity. For example, in flows to Spain – the destination country associated with the most emission-intensive footprint among major buyers, at 1.23 tCO2-eq per tonne of soy – land-use change accounted for 63% of all emissions, or nearly 0.8 tCO2-eq per tonne. In flows to China, by contrast, land-use change accounted emissions of less than 0.2 tCO2-eq per tonne – only 27% of the total footprint.
Most of the land-use change emissions were in the Brazilian Amazon or the Cerrado, particularly the deforestation frontier region of Matopiba. Exports originating in Piauí state (the “pi” in Matopiba) were by far the most emissions-intensive, accounting for an average of more than 4.1 tCO2-eq per tonne of soy, of which around 3.6 tCO2-eq per tonne were from land-use change. Only four other states were associated with average land-use change emissions of more than 1.4 tCO2-eq per tonne: Tocantins (1.9 tCO2-eq/t), Maranhão (1.66 tCO2-eq/t), Pará (1.51 tCO2-eq/t) and Bahia (1.48 tCO2-eq/t).
Emissions from energy input to industrial processing of the soy also varied widely, ranging from 0.03 tCO2-eq per tonne in the case of soy exports from Brazil to Vietnam, to 0.22 tCO2-eq per tonne in exports to Taiwan. Countries importing a large share of soy products already crushed in Brazil tended to have smaller footprints, due to Brazil’s comparatively low-carbon energy system.
Domestic transportation of the soy (24.9% of emissions across all the flows) was also highly variable, depending on where in Brazil soy was sourced in relation to ports and what mode of transport was used (road vs rail). Maritime shipping emissions (10.2% of all emissions) were mainly shaped by the distances from Brazil to the import market, although these emissions were calculated on a per-vessel and per-journey basis. In the case of China, combined transport emissions across all imports were larger than the emissions from land conversion – which was not the case for the EU.
Emissions from further stages of the supply chain – domestic transportation in the importing countries, emissions from consumption (mostly as feed in livestock production), and waste are all slated to be included in the future.
Implications and opportunities
The new approach has a clear application in improving carbon footprinting and the accounting of Scope 1 and Scope 3 emissions related to the food industry, and other sectors reliant on agricultural commodities.
But the detailed breakdown of emissions sources can also inform climate policy discussions, shedding new light on the most efficient investments in alternative mitigation options in global supply chains. Land-use change is a critical area for climate mitigation in contexts with high tropical deforestation (South America, Africa, South East Asia). But other important opportunities could well be found along the supply chain; for example, investing in infrastructure to reduce transport emissions, in better deforestation monitoring and verification, in enforcing lower fertiliser application, or in more fuel-efficient maritime cargo vessels and logistics.
The cost-effectiveness of investment in each of these will vary commodity by commodity, production landscape by production landscape, trader by trader. This new, spatially explicit approach is uniquely capable of capturing and quantifying these differences and thus supporting better reporting, verification and climate mitigation planning.